Photo by Abdul Kayum on FreeImages
Validating satellite-derived wetland inundation maps requires a ground-truth baseline of water levels over time. In-situ submersible water level loggers provide this continuous time-series data. However, raw data downloads from field loggers are highly granular, noisy, and prone to environmental fluctuations, making them unsuited for direct comparison with satellite imagery.
To bridge this gap, an analytics engineering approach is required: transforming raw, high-frequency water logger data into structured, event-driven data models. This case study outlines the architecture of a reusable data pipeline I designed and implemented to ingest logger datasets, handle signal noise, and delineate discrete hydrological events (high flow, low flow, and cease-to-flow) for map evaluation.
1. The architectural challenge: Raw logger data noise
Submersible loggers record raw hydrostatic pressure at fixed intervals (in our case, daily). Transforming this raw, continuous signal into distinct, multi-day “hydrologic events” presents two primary data-cleaning challenges:
- The Fluctuation Problem: During low-flow or dry periods, the signal may fluctuate across threshold boundaries. This creates artificial “fragmentation” of a single event.
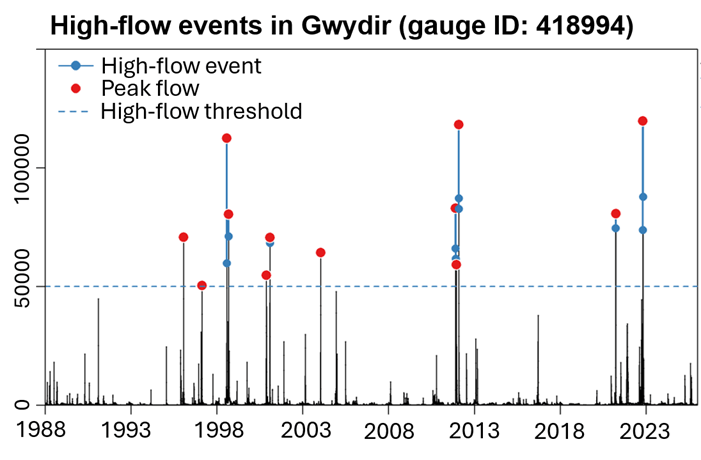
- The Multi-Pulse Problem: A single high-flow event often features multiple distinct peaks (local maxima) caused by sequential weather systems. Treating these as separate events distorts downstream statistical models.
To resolve this, the pipeline incorporates parameter-driven logic—such as a user-defined minimum separation time (gap tolerance)—to smooth out sensor noise and prevent artificial event splitting.
2. Pipeline design and data modelling
The solution is split into two logical layers: a Time-series layer for daily threshold classification, and an aggregated dimensional layer for event-level metrics.
Layer 1: The daily event timeseries (binary modelling)
The pipeline ingests the raw logger data and scales it against site-specific thresholds—such as Environmental Water Requirements (EWR) definitions (e.g., bank-full levels for high flow, or cease-to-flow limits). Instead of requiring analysts to compute threshold intersections downstream, the pipeline outputs a standardised, pre-flagged daily asset.
| field | type | description |
| gauge_id | String | Unique identifier for the water logger station |
| Date | Date | Date of measurement |
| Q | Float | Logger-derived volumetric flow or water level status |
| hf_event | Integer (0/1) | Binary indicator for an active high-flow event |
| lf_event | Integer (0/1) | Binary indicator for an active low-flow event |
| ctf_event | Integer (0/1) | Binary indicator for an active cease-to-flow event |
Layer 2: The Aggregated Event Model (Feature Engineering)
To evaluate spatial inundation maps, data teams must compare whole environmental events rather than isolated days. The pipeline compresses the daily binary time-series into an aggregated event dimension table. Advanced metrics are engineered directly into the schema to describe the specific anatomy of each high-flow pulse.
Key engineered metrics in this layer include:
- Hydrograph dynamics: Segmented volume metrics, specifically tracking cumulative volume up to the peak (
cum_flow_to_peak) versus the volume during the drainage phase (cum_flow_from_peak) to quantify recession rates. - Sub-event counting: A peak-detection function that tracks the number of local maxima (
N_sub_events) based on the magnitude of the recessions between pulses, indicating whether a flood was a single wave or a multi-stage event.
3. Contextual Enrichment: Antecedent Conditions
The environmental impact of a high-water event depends heavily on the catchment’s state prior to the event. A flood hitting an already saturated wetland behaves differently than one hitting a dry basin.
To provide analytical context, the pipeline features an antecedent condition module. Before finalising the records, a window function calculates the flow statistics (cumulative volume, variability, and event history) over the preceding days relative to the event_start_date.
This converts a simple date range into an enriched feature set, allowing downstream analysts to filter instantly for specific conditions, such as “High-flow events occurring immediately after a prolonged dry period.”
4. Production Value and Impact
By treating raw logger files with strict analytics engineering principles, this pipeline provides several systemic benefits:
- Portability & scale: Built with decoupled, modular logic in R/Python, the pipeline is designed to interface with cloud data platforms once schemas are finalised.
- Systematic map validation: Analysts can cleanly join specific logger event IDs directly to satellite capture dates, simplifying the evaluation of inundation map accuracy.
- Data gap filling: By modelling the historical correlation between logger-measured water levels and observed surface water extent, the pipeline provides a foundation for inferring wetland dynamics on days when cloud cover obscures satellite visibility.
