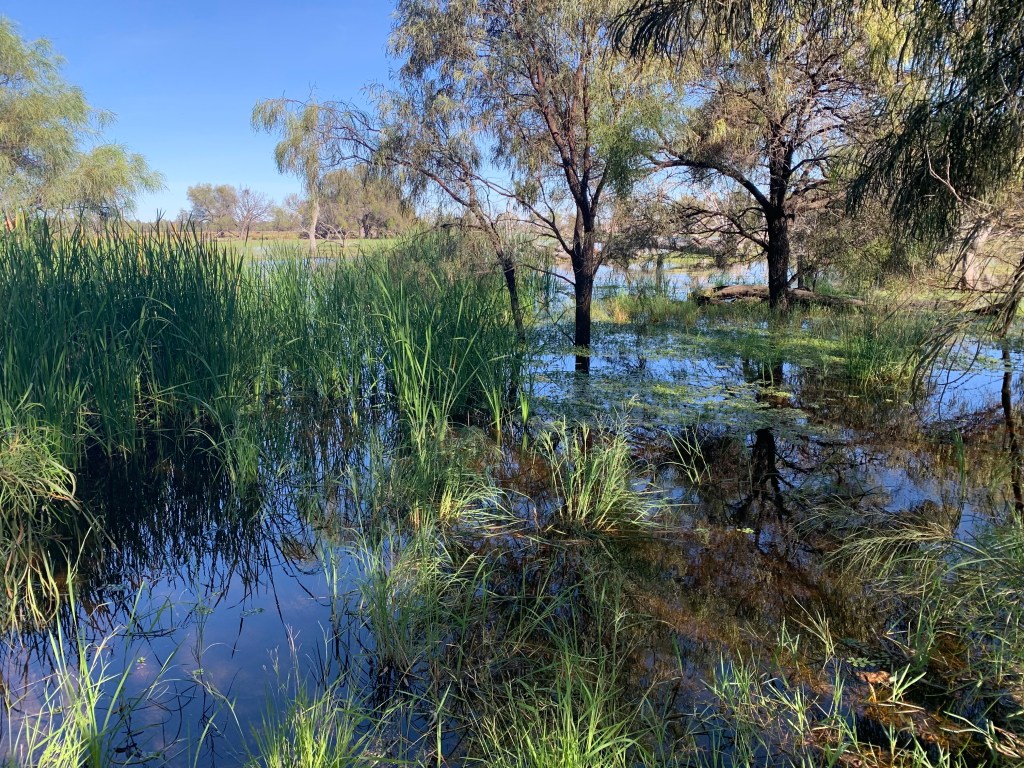
Murray Darling River. Photograph by Marie Attard
The NSW Murray-Darling Basin spans one of Australia’s most complex river and wetland networks, making large-scale geospatial analysis a challenge. To map water dynamics effectively across this region, I built a reproducible Python workflow that transforms raw geospatial data into actionable insights, helping uncover wetland distribution patterns and pinpoint where automated remote sensing is likely to succeed for real-time flood monitoring across wetlands—and where it falls short.
The Core Challenge: Sifting Noise from Priority
Expanding inundation monitoring across New South Wales comes with a distinct problem: much of the NSW MDB region is highly arid, and many wetlands are entirely rain-fed, meaning environmental flows cannot be actively delivered to them. Furthermore, vast stretches of the landscape consist of urban hubs or intensive agricultural zones (such as intensive cropping) that are not relevant for statutory reporting under the federal Basin Plan.
To help our inundation team define data products that meet end-user requirements, I built this pipeline to answer two critical operational questions:
Risk: What is the spatial distribution of mapping risks (terrain, canopy cover, and data gaps) that threaten map accuracy?
Scope: What is the actual net area of the region that genuinely requires environmental monitoring?
Architecture & Data Ingestion: Automation at Scale
The python script uses GeoPandas to isolate, query, and process data using standardised geographic boundaries known as Long-Term Water Plan Planning Units (LTWP PUs).
Overall, the pipeline handles everything from the initial data-cleaning phase to running complex, multi-variable spatial matrices. It strips away manual pre-processing friction by reading disparate vector and raster inputs, standardising their attributes, and executing deep statistical analyses across the basin. The codebase is heavily documented inline, embedding the precise hydrological and mathematical logic directly into the script architecture to ensure the entire process is fully transparent and reproducible for the team.
What the Pipeline Assesses
The code programmatically intersects these massive spatial layers to isolate patterns across five critical themes, automatically partitioning and exporting the resulting data tables, charts, and figures into our centralised project output directory:
| Theme | Analytical Target and Operational Logic |
| 1. Remote Sensing Complexity | Flags and ranks individual PUs based on terrain challenges, dense canopy cover, or cloud interference—identifying exactly where automated remote sensing methods face the highest risk of misclassification or data noise. |
| 2. Macro-Level Basin Trends | Aggregates localised data to establish broad baseline statistics and landscape trends across the entire NSW Murray Darling Basin footprint. |
| 3. Water Regimes & Floodplains | Quantifies net wetland areas cross-referenced by Water Regime × System Type obtained from ANAE to determine the exact proportion of active floodplains versus non-floodplain systems. |
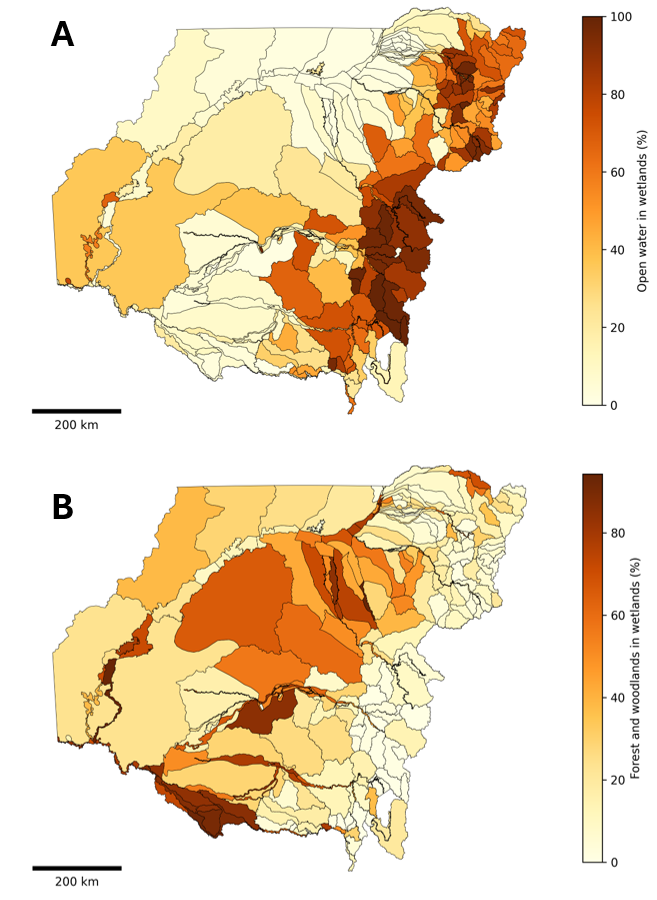
| 4. Spatial Wetland Distribution | Computes and maps out exactly how densely or sparsely wetland systems are distributed across individual LTWP Planning Unit vectors. |
| 5. Ecological Composition | Evaluates the underlying environmental characteristics of each wetland zone, breaking down the spatial footprint of distinct plant and forest communities. |
